
The readings, in full
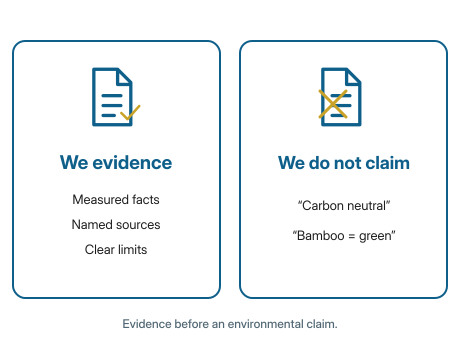
Three measurements taken on the boat the company is run from, each with the week it was read and the instrument that read it. This is the evidence behind the summary on the environmental report.
How these were taken
The company is run from a 55ft widebeam on the River Great Ouse, off grid since 19 June 2026. The instruments are Victron Cerbo GX with a BMV-712 battery monitor, a SmartSolar MPPT charge controller and a MultiPlus-II inverter, plus per-circuit energy plugs, all logged through Home Assistant. Nothing here is modelled or estimated: each row is a figure read off a meter over the week stated.
| Measured | Figure | When | How |
|---|---|---|---|
| Solar generation, midsummer | 4 to 12 kWh a day, averaging about 8.5 | 19 to 25 June 2026 | Victron SmartSolar MPPT via Home Assistant |
| Metered office load | about 5.4 kWh a day across the circuits with a meter on them | 18 to 25 June 2026, seven-day average | per-circuit energy plugs via Home Assistant |
| The single biggest load | a server drawing 116 W, about 2.8 kWh a day | 18 to 25 June 2026, seven-day average | per-circuit energy plug via Home Assistant |
What the measurement changed
On the sunniest days of the year the battery still finished the day below its 50 per cent floor. The measurement said the always-on computing was about half the daily budget, so on 28 June 2026 that server was switched off for good and what it did moved to a data centre that runs on renewable power. It is a smaller claim than "we run on solar" and it is the true one.
What is missing, and why
These readings are from midsummer, which is the flattering end of the year. There is no winter figure here because we have not finished measuring one. When we have, it will go on this page whatever it says — including if it makes the summary on the report look worse.
If a figure here is out of date, or you want the winter numbers when they exist, email hello@universalcontacts.co.uk and you will get an answer from a person.